Topic Updated: April 01, 2025
Callbacks Tool Features
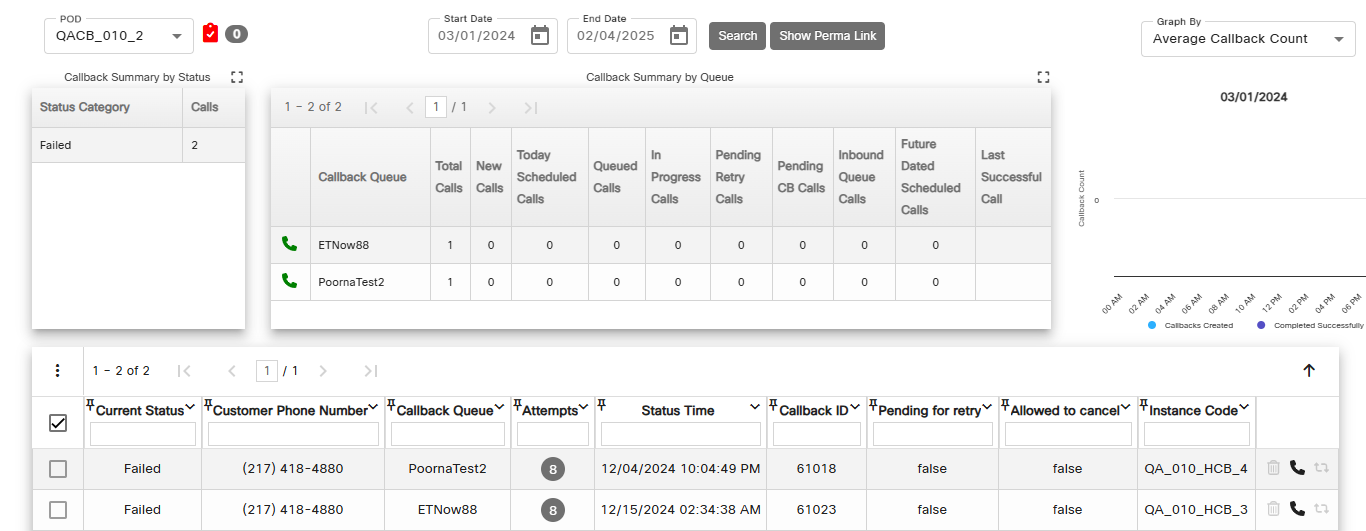
The Callbacks page displays a list of callbacks along with several other details and important information about their status. From this page, users can:
- Select a date range for viewing call backs status
- View callback summary by status
- View callback summary by queue
- View callback status bar graphs for specific dates
- Cancel callbacks
- Export callback data
Using the Callbacks Features
- POD Code – Allows for the selection of a POD code if multiple PODs are available. The page displays callbacks data for the selected POD. (This option is only available to internal users.)
- Offer Callback Status Icons:
- Offer Callback Automation Status – This icon indicates that Offer Callback Automation is enabled or disabled. A green icon indicates Offer Callback Automation is enabled, and red icon indicates it is disabled.
- Offer Callback Status – This icon indicates when the Offer Callbacks features is enabled or disabled. A green icon indicates Offer Callbacks are enabled. When disabled, this icon contains a red slash overlaying it. If Offer Callback Automation is disabled, this icon does not display.
- Pending Callback Calls Count – Displays the total number of pending callbacks.

- Start Date – Enter or select the beginning date for the range of callbacks data to display. This field also defines the day for which graph data displays under the Graph By section.
- End Date – Enter or select the ending date for the range of callbacks data to display.
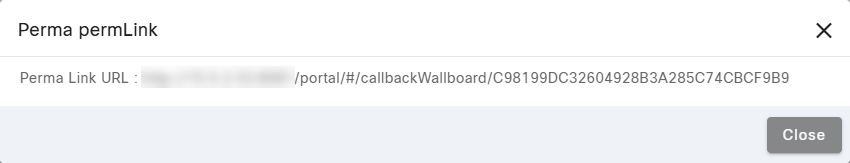
- Show Perma Link – Provides a URL which an organization can use to display the Callbacks dashboard on a wallboard, outside of Portal. Copy and paste the generated URL into a web browser and the wallboard displays without requiring you to sign in. To learn more about the wallboard, see Using the Callbacks Wallboard.
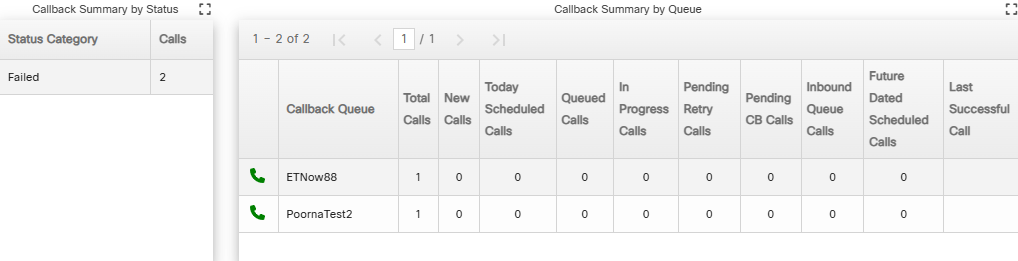
- Expand Icon – Click this icon to open the Callback Summary by Status or Callback Summary by Queue tables in an expanded view dialog.

- Callback Summary by Status – Displays a breakdown of callbacks within a selected date range, categorized by their status. Users can see the number of callbacks that occurred between the start and end dates, based on the time zone of their device.
- Callback Summary by Queue – Shows a summary of callbacks within a selected date range, organized by queue. The data updates to reflect the number of callbacks that occurred between the start and end dates, displayed according to the time zone of the user's device.
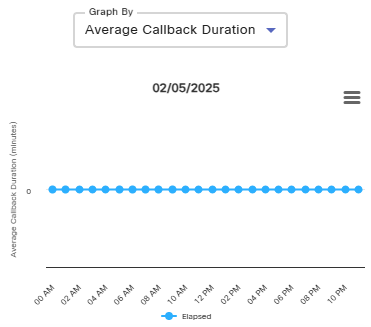
- Graph By – Allows for the selection of different chart types for viewing more callback details throughout a selected day in the Start Datefield. Use this drop-menu to select one of the charts described below:
- Average Callback Count – Displays a chart that shows the average number of callbacks requested over a selected time period.
- Average Callback Duration – Displays a chart that shows the average time taken to complete a callback from initiation to resolution.
- Average Virtual Queue – Displays a chart that shows the average number of callers waiting in the virtual queue before receiving a callback.
- Average ICM Queue – Displays a chart that shows the average number of callbacks waiting in the ICM queue before being handled.
- Chart Menu – Click to reveal the additional chart options described below:
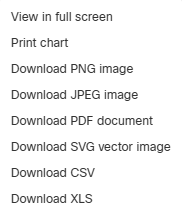
- View in full screen – Opens the chart in a full screen viewing mode.
- Print chart – Use this option to print the chart.
- Download PNG image – Allows you to download the chart in the PNG image format. This format is less compressed and provides a higher quality image.
- Download JPEG image – Allows you to download the chart in the JPG image format. This format is compressed and offers a much smaller file size.
- Download PDF document – Allows you to download the chart in the PDF document format. The PDF document format is commonly used for digital document distribution through email or websites.
- Download SVG vector image – Saves the chart in the SVG image format. This format allows you to easily import and edit the image within most illustration software applications, such as Adobe Illustrator, with zero quality loss scaling.
- Download CSV – Downloads the chart in the CSV format which can be opened using a spreadsheet application, such as Microsoft Excel.
- Download XLS – Downloads the chart in the XLS format which can be opened using a spreadsheet application, such as Microsoft Excel.
Using the Callbacks Grid
Using the Grid Menu for Callbacks
The grid menu provides the following additional controls and features:
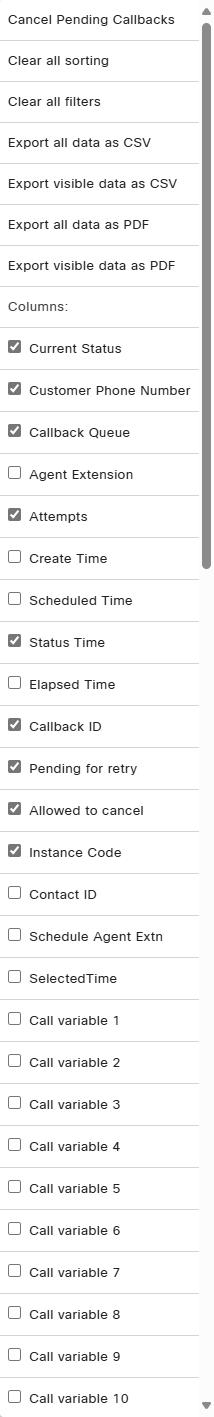
- Cancel Selected Callbacks – Cancels the selected callbacks if displaying "true" under the Allowed to Cancel column.
- Cancel Pending Callbacks – Cancels any callbacks displaying "true" under the Pending for Retry column.
- Clear all sorting – Clears all sorting used on the Callbacks grid.
- Clear all filters – Clears all filters used on the Callbacks grid.
- Export Data – Export Callbacks grid data in CSV and PDF file formats.
For additional information about exporting grid data, see Export and View Grid Data
- Columns – Show or hide any of the columns on the Callbacks grid. (For additional information about showing or hiding columns, see Show or Hide Columns on a Grid.)
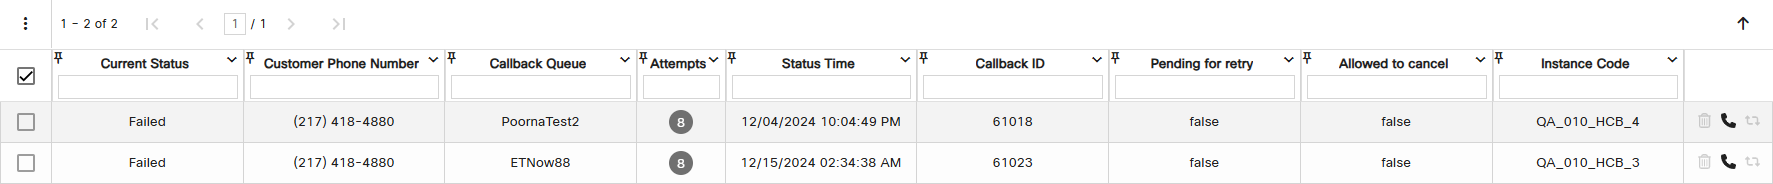
- Current Status Column – Displays the current status of the callback.
- Customer Phone Number Column – Displays the phone number of the customer requesting a callback.
- Callback Queue Column – Displays the callbacks queue type.
- Agent Extension Column – Displays the agent's extension.
- Attempts Column – Displays the number of times a callback has been attempted.
NOTE:
Clicking on a number opens the Callback Attempt dialog for viewing additional details. When finished viewing, click the X button to close the dialog.
- Create Time Column – Displays the date and time a callback was created.
- Scheduled Time Column – Displays the date and time a callback is scheduled.
- Status Time Column – Displays the date and time a callback was assigned the current status.
- Elapsed Time Column – Displays the amount of time elapsed for the callback.
- Callback ID Column – Displays the ID assigned to the callback.
- Pending for Retry Column – Displays true if a callback is pending a retry, or false if it is not pending a retry.
- Allowed to Cancel Column – Displays true if a callback is allowed to be canceled, or false if a callback cannot be canceled.
- Instance Code Column – Displays the instance code for the callback.
- Contact ID Column – Displays the contact ID assigned to the callback.
- Schedule Agent Extn – Displays the extension for the agent that created the callback.
- Selected Time – Displays the time selected for the callback.
- Call Variable 1 - 10 – Displays any call variables used for the callback. (These are optional columns and are not displayed by default.)
Selecting Callbacks on the Grid
Allows for the selection of callbacks within the Callbacks grid. The selection indicator located at the very top, in the column header, selects or deselects all listed callbacks. Selecting callbacks adds the option to export only selected data from the grid menu. You can also use the Cancel Selected Callbacks option found on the grid menu to cancel the callbacks that are selected.

Not Selected

Selected
Using the Task Icons on the Callbacks Grid
Task icons perform a variety of actions for each callback listed on the Callbacks grid. See the task icon descriptions below:
 Cancel Callback – Cancels a callback if the callback is allowed to be canceled. (See Cancel a Callback for additional assistance.)
 Call Legs Info – Displays the Call Legs Info dialog for the callback.
  Re-Queue Callback – Allows users to re-queue callbacks. (See Re-Queue a Callback for additional assistance.)


See Also
Copyright © 2025 Cisco. All rights reserved.
![]()
![]()
![]()