Topic Updated: April 01, 2025
Dashboard
The Portal Dashboard offers two useful tools for monitoring the contact center activity and status:
- Contact Center - Select and customize variou s Dashboard Widgets to display contact center details for:
- Queued Calls
- Agent Utilization
- Average Handle Time
- Average Speed of Answer
- Service Level
- Trending
Contact Center
In order to help facilitate customers with real-time monitoring of their contact centers, Portal now provides six embedded call center dashboards. These dashboards allow users some interactive capabilities in order to drill down into important contact center data. This functionality is controlled by Portal access and security. Users can select one or more of the available dashboards and easily select filter criteria for each one by call types or skill groups, agent teams, refresh rates, and time zone. The data available within the dashboards is derived from the
The Dashboard Contact Center is a feature of the system that provides a birds eye view of Queued Calls, Agent Utilization, Average Handle Time, Average Speed of Answer, Service Level, and Abandoned Calls.
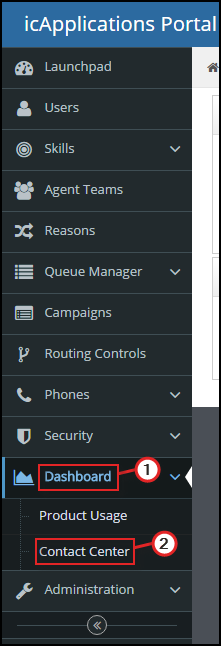
Once you are logged into the Portal, to access the Dashboard, go to the Navigation pane, on the left side of the screen, as shown below in screen capture. Select Dashboard, and then select Contact Center.
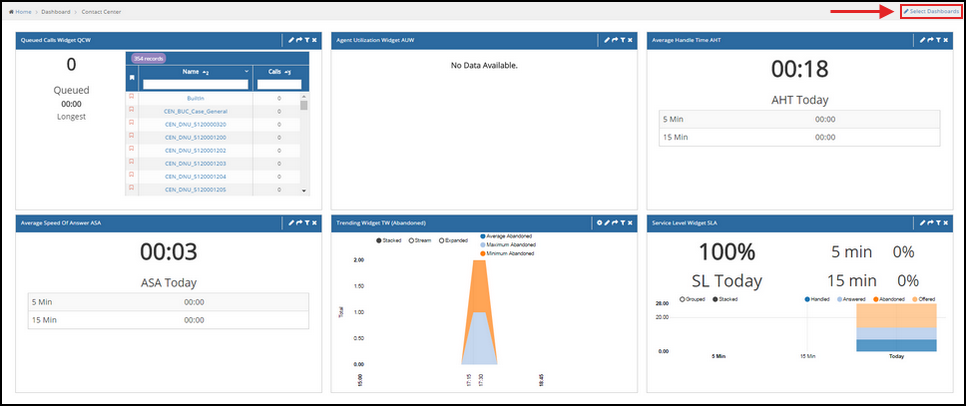
If you have already set up the widgets - icons that give you a birds eye view of features (e.g., abandoned calls, agent handle times, average speed of answer, etc.) as shown in screen capture below, they will automatically be displayed when you click on Contact Center the next time you log in.
However, if you have not set up the Widgets, Click Select Dashboards, located on the top right side of your screen. Shown in screen capture below.
The available Dashboard Widgets are as follows:
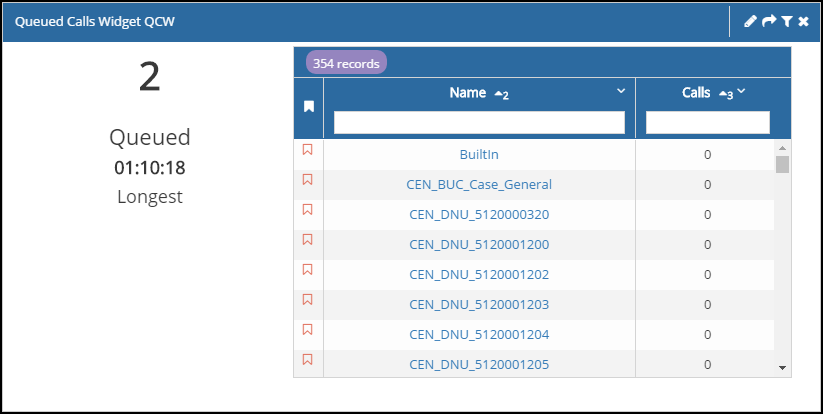
Queued Calls – provides a list of call types or skill groups and how many calls are in queue for each of them at the time of the refresh. It also displays the longest currently queued call of the selected call types or skill groups. From this widget, Call Types and Skill Groups can be accessed by supervisors so they can more efficiently assign agents to high call volumes. Call Types and Skill Groups that consistently have higher call volumes can be pinned to the top of the list so they can be monitored and to take action more efficiently.
Agent Utilization – provides occupancy percentage, total active agents in a state other than ‘Not Ready’, graphical representation of active agent states and the ability to see how many agents are in each state, ability to select which agent states show in the graph.
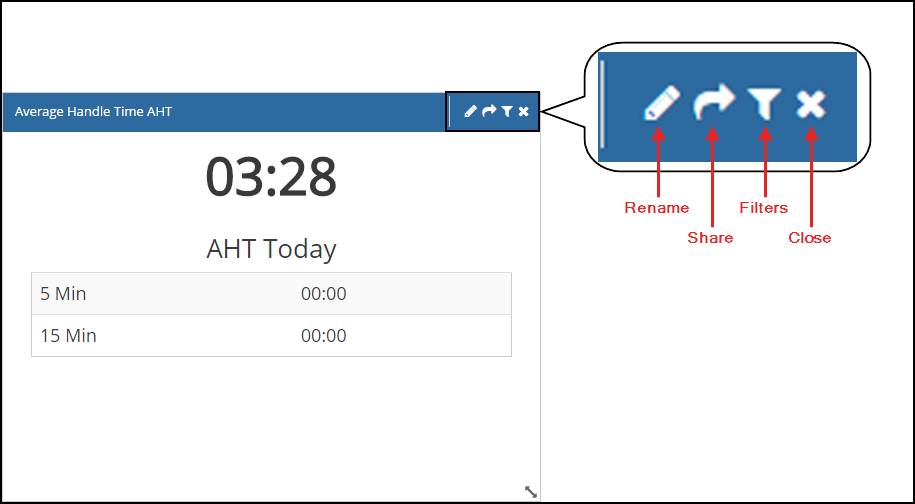
Average Handle Time (AHT) – provides the average handle time for all calls received since midnight, or the average handle time for the last 5 and 15 minute intervals.
Average Speed of Answer (ASA) – provides the average speed of answer for all calls handled since midnight, and the average speed of calls for the last 5 and 15 minute intervals.
Service Level (SL) – provides the service level percentage for the day since midnight, and the service level for the last 5 minute and 15 minute intervals. It is a graphical representation of calls offered, calls answered, calls abandoned to queue, and calls abandoned to agent. The widget also allows you to adjust the graph to show any combination of those statistics.
Trending – provides a graphical representation of the highest, average, and today's current values from over a four week period. It can also be configured to show offered calls, answered calls, or abandoned calls.
After selecting the Select Dashboard option, the Dashboard Configuration will display. Here you can select the widgets you want to display.
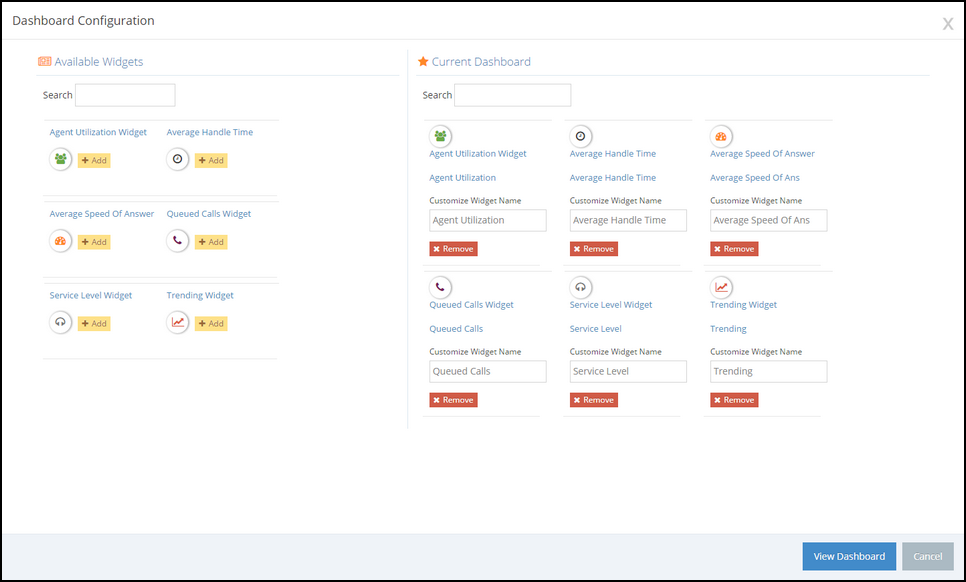
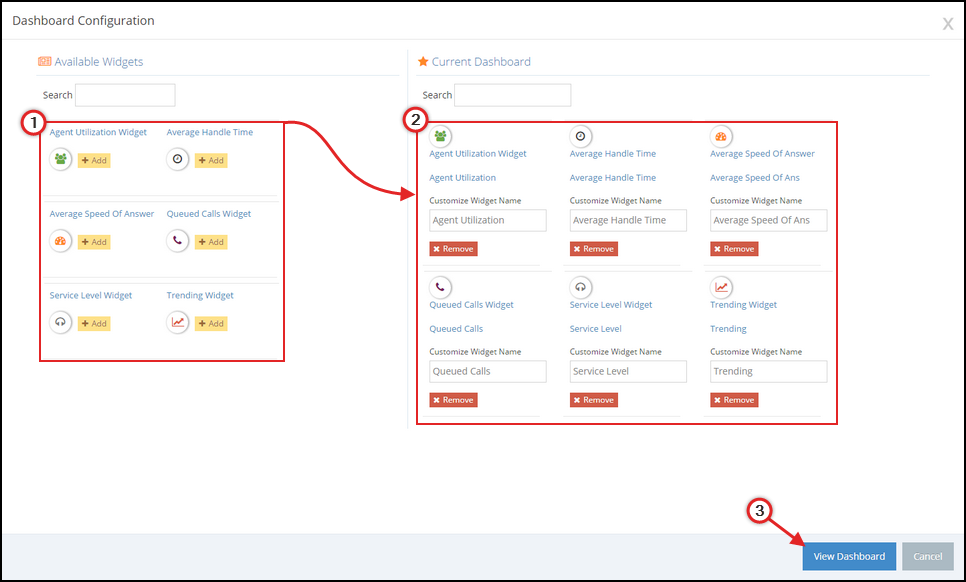
All Available Widgets are displayed on the left side of the Dashboard Configuration. Add widgets by selecting the Add button located below each. As widgets are added they will display under the Current Dashboard section. From here, you can assign each widget selected a custom name by entering text into the Customize Widget Name text box. When you have finished naming the widgets you selected, click the View Dashboard button to return to the Contact Center Dashboard.
If you want to remove any widgets, simply select the Remove button below widget's name.
NOTE: You can add more than one instance of each widget, and each of them may have different filters applied to show a wider variety of information and details.
On the right side of each widget's title bar, you will find a set of buttons that allow you to make changes.
- Rename – change the name of the widget.
- Share – creates a PermaLink, which is a URL that can be shared with others. The widget's settings are saved within the PermaLink. Any user viewing the PermaLink must log into Portal.
- Filters – allows you to apply filters to the widget. These filters include Call Type or Skill Group, Agent Teams
- Close – closes and removes the widget from the dashboard. A confirmation dialog box appears upon clicking the Close button.
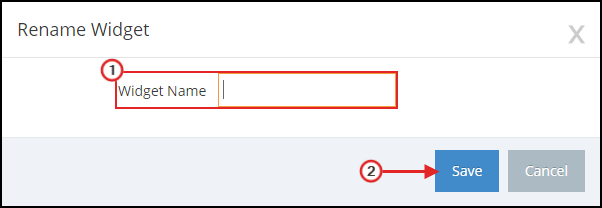
Renaming a Widget
To rename a widget, click the Rename button located on the widget's title bar. The Rename Widget dialog appears. Enter a name into the Widget Name text field, and then click the Save button.
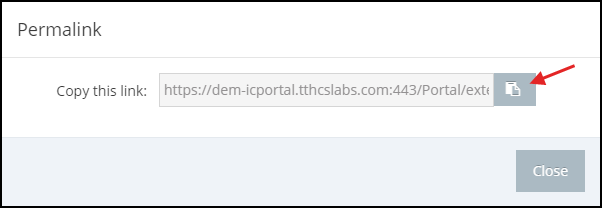
Sharing a Widget
To share a widget, click the Share button located on the widgets title bar, and the Permalink dialog opens. From here, you can click the Clipboard icon as depicted below to copy the generated link. After the button has been clicked, you can now paste the link.
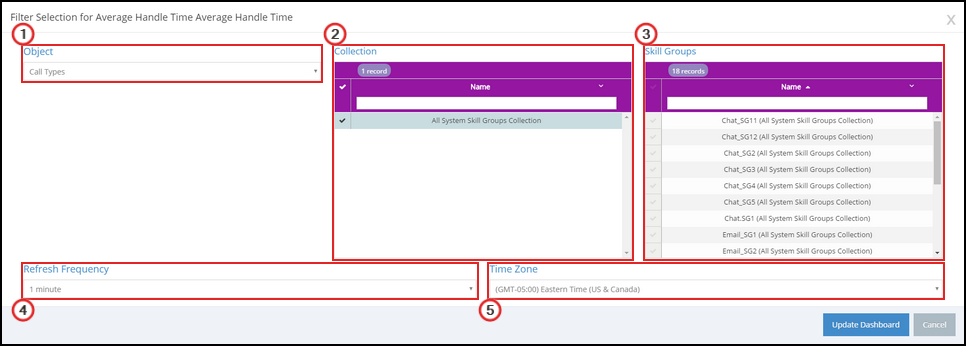
Applying Filters to a Widget
To apply filters to a widget, click the Filter icon from widget's title bar. The Filter Selection for... dialog opens.
- Object – click the drop-down box to select the filter type you would like to apply. Depending on the widget you are editing, the selections available will be Call Types, Skill Groups, or Agent Teams.
- Collection – this section populates after selecting an object. Place a check next to each collection that you want to include in the widget filter. To find collections quicker, enter the name into the text field below Name.
- Skill Groups, Call Types, or Agent Teams – the name of this section will differ depending on which widget you are editing, or which object is selected. As collections are selected, this section begins to populate. Place a check next to each option you want to include in the filter. Just like the Collection section, you can enter text into the text field below Name to filter through the available options quicker.
- Refresh Frequency – allows you to choose how often the widget updates the data and information displayed.
- Time Zone – Select the time zone in which the widget will report. This selection defaults to the time zone your company selected during the initial icIntellect installation. If you are in a different time zone than your company, select the option that best fits your location. If filtering for an agent team in a different location, select their current time zone.
After configuring the filters, click the Update Dashboard button to apply them to the widget.
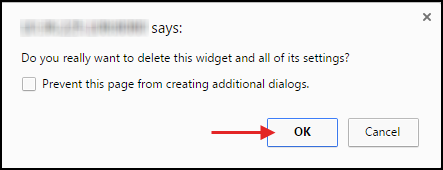
Closing a Widget
To close a widget, click the Close button located on the widget's title bar. When the Close button is selected, a dialog displays to confirm you want to delete the widget and all settings that have been configured for it. Click the OK button if you are sure you want to delete it.
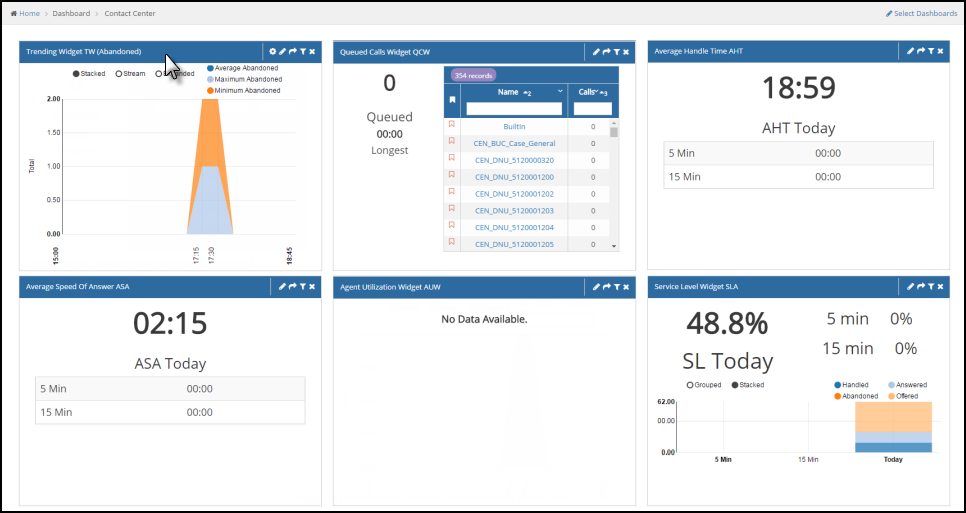
Reposition Dashboard Widgets
Widgets can easily be repositioned to customize the look of the dashboard.
1. Click and drag the title bar of the widget you would like to move.
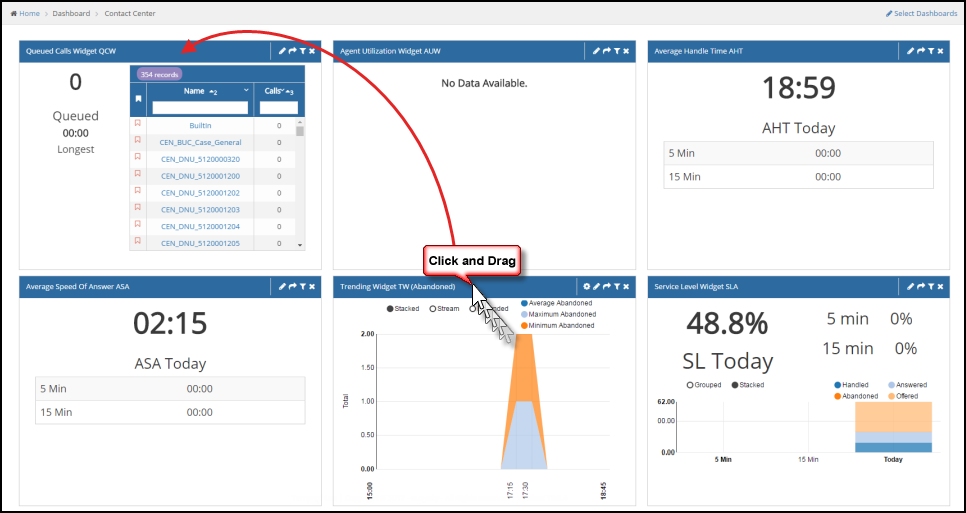
2. Drag the widget to the new location, and then release it.
Resizing a Widget
Widgets can be resized to display more information and graphical data.
1. Move the mouse pointer near the edge on the bottom right side of the widget window. The mouse pointer changes to a double-sided arrow indicating you can click and drag to resize.
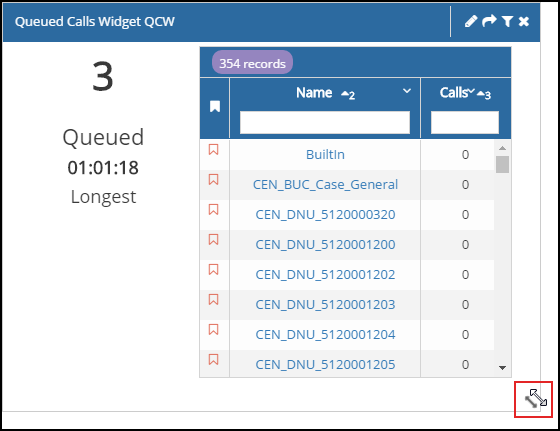
2. Click and drag the widget window vertically or horizontally to the desired size, and then release the mouse button. The widget window now displays with the new size. Any adjacent widgets are repositioned to accommodate the new size.
Please let us know how we can improve this topic by clicking the link below:
© TTEC Digital 2025
![]()
![]()
![]()